Infrastructure owners today are not short of data. Bridges, pump houses, transformers, railway assets and industrial equipment now generate a continuous stream of sensor readings, inspection reports and operational records. The problem is rarely a lack of information — it is the absence of a connected system that turns that information into early warnings, predictive insight and confident maintenance decisions.
A Digital Twin for predictive maintenance closes exactly this gap. It links the digital representation of a physical asset to real-world condition data and analytics, so teams can move from knowing what happened to understanding what is happening now — and anticipating what could happen next.
This guide explains how that works in practice: the technology stack, a step-by-step workflow, a maturity model, real infrastructure scenarios, the honest challenges, and a practical roadmap for getting started.
What Is a Digital Twin for Predictive Maintenance?
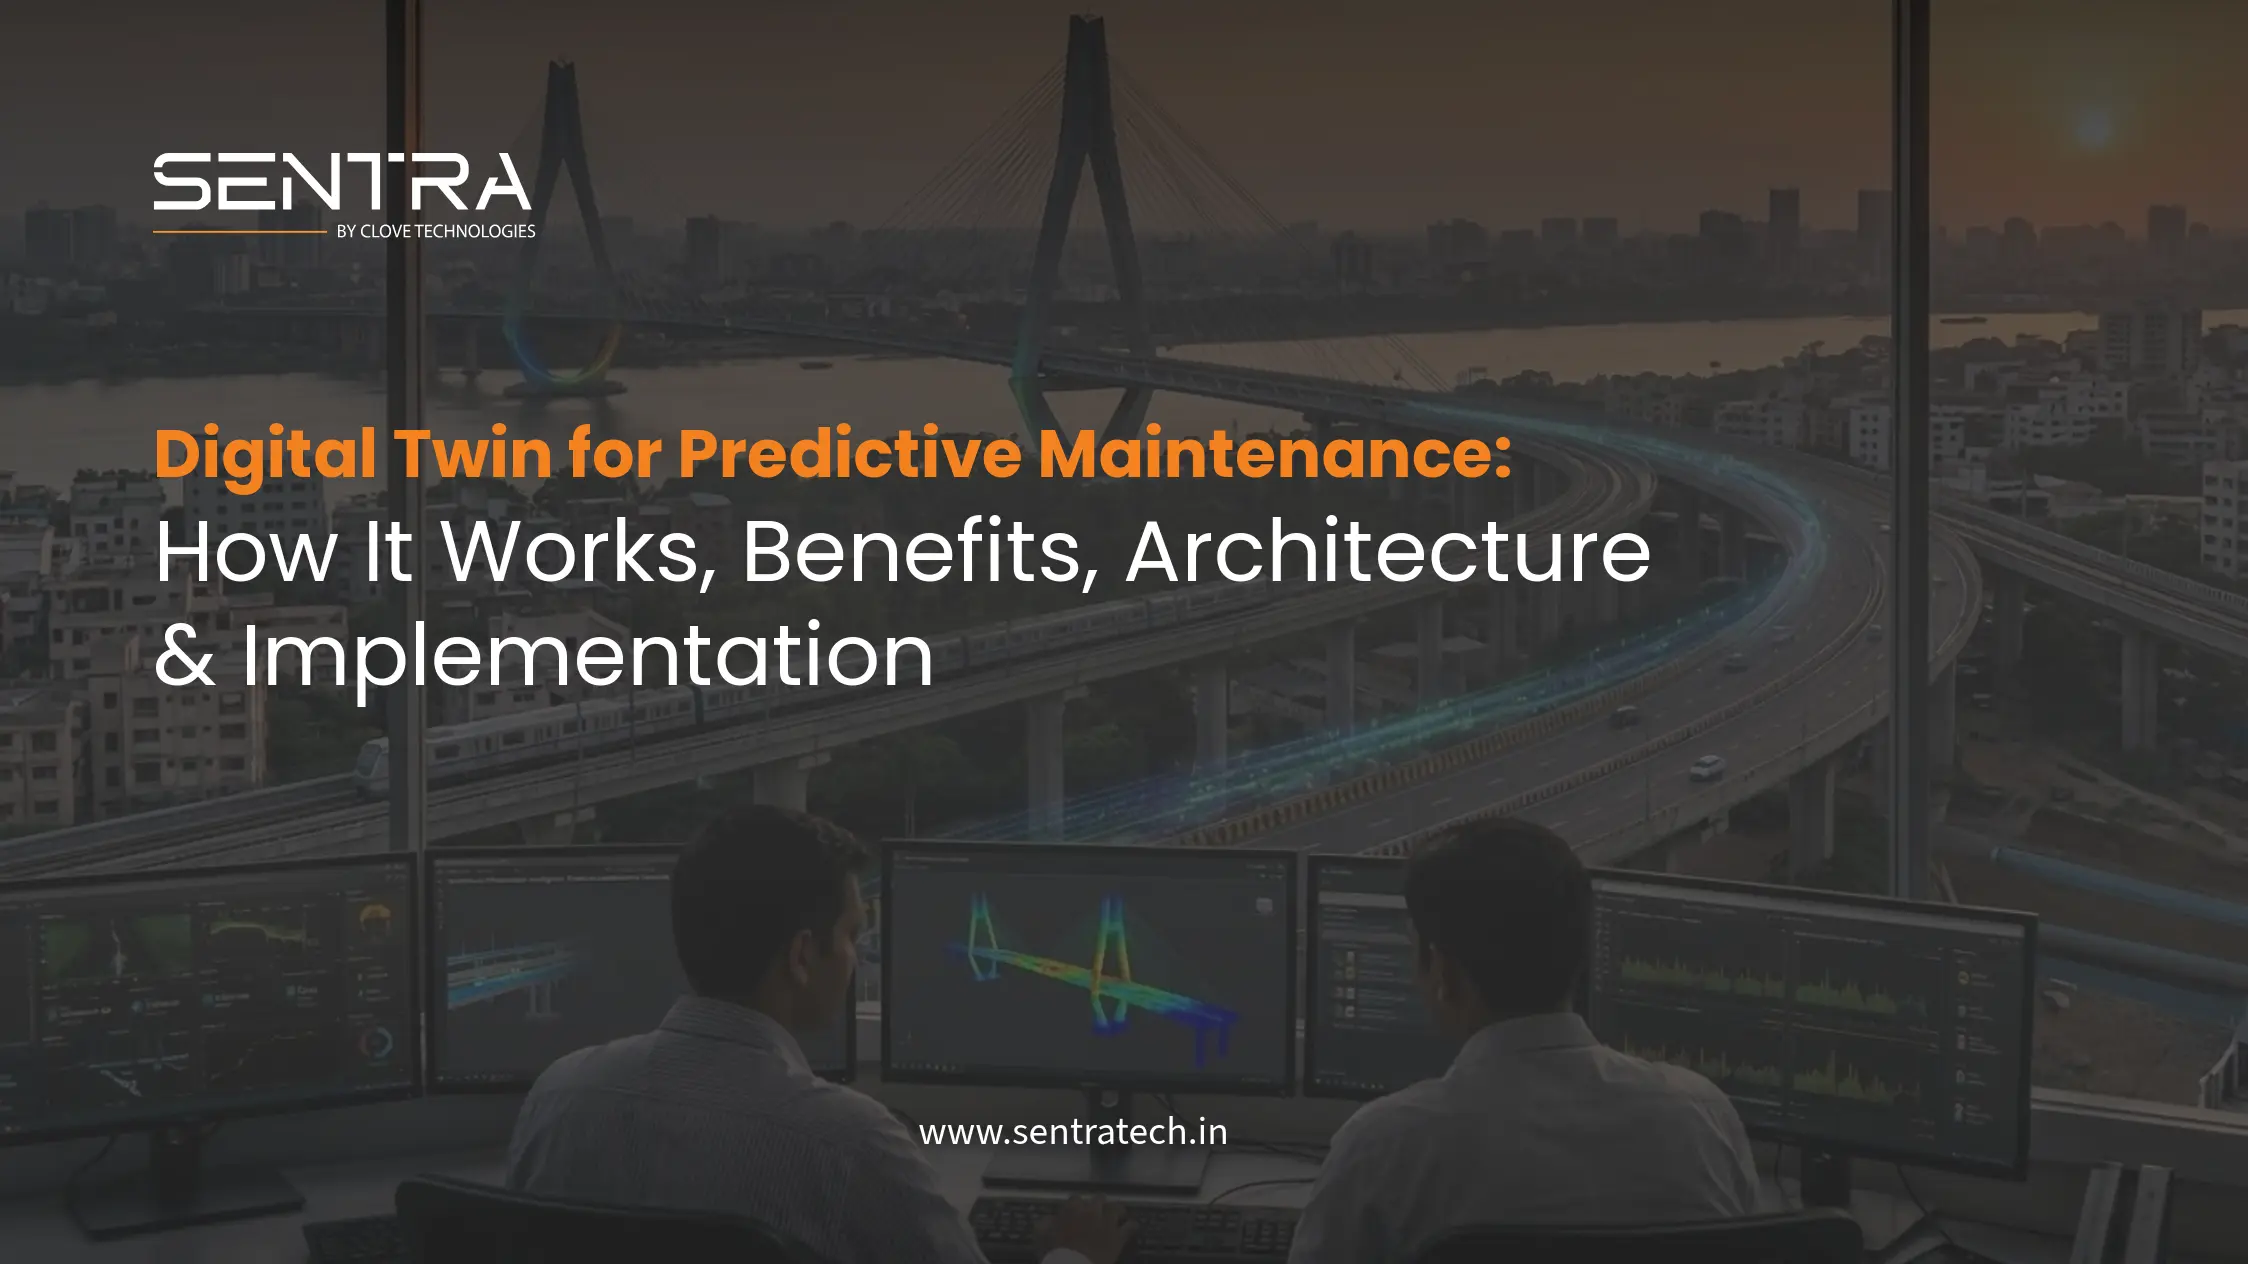
A Digital Twin for predictive maintenance is a dynamic digital representation of a physical asset that combines asset information, real-time sensor data, operational data and analytics to monitor asset condition, detect abnormal behaviour, and support maintenance decisions before failures occur. Unlike a static 3D model, it continuously updates as the physical asset changes.
Three ideas make this definition work.
First, it is dynamic. A drawing or a BIM model describes an asset at a point in time. A Digital Twin stays synchronised with the real asset through live data. The international standard for manufacturing digital twins, ISO 23247, captures this precisely — it defines a digital twin as a fit-for-purpose digital representation of an observable element, with synchronisation between the element and its digital representation. That synchronisation is the whole point.
Second, it is contextual. Raw sensor values on their own mean little. A vibration reading becomes meaningful only when it sits alongside the asset's design, its history, its operating conditions and its normal behaviour. The Digital Twin provides that context.
Third, it is decision-oriented. A predictive maintenance twin is not built to look impressive on a screen. It exists to answer operational questions: Is this asset healthy? Is something changing? How urgent is it? What should we do, and when?
Why Traditional Maintenance Strategies Are Changing
Most infrastructure and industrial operations still manage equipment in one of two ways — and both waste money.
Reactive maintenance runs an asset until it fails, then repairs it. It looks cheap because nothing is spent until something breaks. In reality it is the most expensive strategy: emergency labour, expedited parts, secondary damage and unplanned downtime all land at once, at the worst possible moment. U.S. Department of Energy analysis has long indicated that reactive maintenance typically costs three to five times more than planned maintenance.
Preventive maintenance replaces or services components on fixed calendar or cycle intervals, regardless of actual condition. It is safer than run-to-failure, but it is blunt. Perfectly serviceable bearings, seals and components get replaced early, consuming spare parts and labour — while failures that develop between scheduled intervals are still missed.
The alternative is a maintenance strategy driven by the actual condition of each individual asset. The progression looks like this:
Failure → Inspection → Emergency repair
Fixed schedule → Inspection → Planned maintenance
Continuous monitoring → Anomaly detection → Prediction → Planned intervention
Physical asset → Digital model → Live sensor data → Asset condition → Analytics → Anomaly detection → Failure prediction → Maintenance decision → Action → Updated asset intelligence
Predictive maintenance is where condition data starts driving decisions. The Digital Twin is what makes predictive maintenance scalable, spatial and continuous — it holds the model, the live data, the history and the analytics in one connected environment.
The economic case is well documented. Department of Energy studies commonly associate a mature predictive programme with meaningful reductions in maintenance cost versus reactive approaches, sharply fewer unexpected breakdowns, and a strong return on programme investment. The exact numbers vary by asset type, data quality and programme maturity, so they should be treated as directional rather than guaranteed — but the direction is consistent across decades of research.
Digital Twin vs Predictive Maintenance: Two Different Things
These terms are often used interchangeably. They should not be.
Predictive maintenance is the strategy — the decision to maintain assets based on their actual condition and predicted failure risk, rather than on fixed schedules or after breakdowns.
A Digital Twin is the enabling environment — the connected digital space where asset information, live data, history and analytics come together to make that strategy possible at scale.
A clean way to hold the distinction:
- IoT sensors provide the data.
- Analytics interpret the data.
- The Digital Twin contextualises the data against the asset model and its history.
- Maintenance systems (CMMS/EAM) convert the resulting insight into work orders and action.
You can practise a limited form of predictive maintenance without a Digital Twin — for instance, watching a vibration trend on a single motor. But as soon as you scale to hundreds of assets across multiple sites, you need the connected context a twin provides to keep it manageable, comparable and spatially understandable. For a deeper look at how AI transforms the entire signal chain from sensor to decision, see our guide on AI-driven infrastructure monitoring.
Digital Twin vs BIM: A Foundation, Not the Same Thing
Because so many infrastructure assets now start life as a BIM model, it is worth being precise about how a Digital Twin differs from BIM.
| BIM | Digital Twin |
|---|---|
| Primarily a digital representation of an asset | A dynamic operational representation |
| Strong design and construction focus | Strong operations and lifecycle focus |
| Mostly structured project information | Connected real-world information |
| Can be static once handed over | Continuously updated from live data |
| Model-centric | Asset + data + analytics-centric |
The relationship is complementary, not competitive. BIM provides the foundation; the Digital Twin extends it. A parametric BIM model — built to a defined level of development and classified to standards such as Uniclass or OmniClass — gives the twin an accurate, structured spatial and semantic backbone. The twin then enriches that backbone with live sensor feeds, maintenance records and analytics, so it reflects the current state of the asset rather than its as-designed or as-built state.
This is why disciplined digital engineering and scan-to-BIM work matters so much for predictive maintenance. If the underlying model is inaccurate or the asset information is fragmented, the twin inherits those weaknesses. A good twin starts with a good model, delivered in line with information-management standards such as ISO 19650 so that data stays accessible for the life of the asset.
The 7-Stage Digital Twin Predictive Maintenance Loop
Most explanations of digital twins stop at visualisation. The value, though, is in a closed loop — insight has to become action, and action has to feed back into the twin. Here is that loop broken into seven stages.
Stage 1 — Build the Digital Asset Foundation
Everything begins with an accurate, structured digital baseline of the asset. This is assembled from BIM models, CAD and GIS data, reality-capture outputs (laser scanning, photogrammetry, scan-to-BIM), asset registers, engineering documentation and historical maintenance records. For existing assets with no reliable as-built records, a scan-to-BIM workflow — 3D laser scanning or photogrammetric survey converted into a parametric model — creates that baseline from physical reality.
Output: a Digital Asset Baseline.
Stage 2 — Connect the Physical Asset
Next, instrument the asset. The right sensor suite depends entirely on the asset type, but for infrastructure and industrial equipment it typically includes vibration and temperature sensors (the earliest indicators of rotating-equipment deterioration), pressure and flow sensors (for pipelines, pumps and hydraulic circuits), power sensors (motor and drive energy draw), environmental sensors (humidity, corrosive gases), and structural monitoring sensors such as tiltmeters, strain gauges, accelerometers and GNSS displacement units for civil assets.
Output: Live Asset Data.
Stage 3 — Stream and Integrate the Data
Sensor data has to travel reliably from the field to the twin: sensor → edge gateway → communication layer → cloud/data platform → Digital Twin. Edge processing units filter, compress and pre-analyse data locally — which keeps alerting responsive and reduces transmission costs, and lets critical local alarms fire even during connectivity outages. Data is stored as time-series telemetry and associated with the correct asset in the model, so every reading has a home and a context.
Output: Connected Asset Data.
Stage 4 — Establish the Asset's Normal Behaviour
This stage is what separates real predictive maintenance from simple threshold alarms. Predictive maintenance cannot rely only on fixed limits, because "normal" is not a single number — it shifts with load, season, ambient conditions and operating mode. So the system learns each asset's baseline: historical patterns, normal vibration and temperature ranges, typical load behaviour, and performance trends under different operating conditions.
Output: an Asset Behaviour Baseline.
Stage 5 — Detect Anomalies
Once normal is understood, analytics can flag deviations from it: unexpected trends, threshold breaches, pattern changes and gradual performance degradation. A crucial distinction lives here:
An alert is not a failure prediction. An alert says: this reading is abnormal. A failure prediction goes further and asks: what does this abnormal behaviour actually mean for this asset? Many systems stop at the alert. A predictive twin uses the alert as an input to the next stage.
Stage 6 — Predict and Prioritise
Here analytics evaluate what the anomaly implies. Depending on data quality and model maturity, this can help identify the probable failure mode, an indicative severity, the asset's criticality to operations, and a recommended intervention window.
Careful language matters. Predictive analytics can help identify, can support and can enable better decisions — it does not deliver certainty. Alert accuracy also improves over time as models accumulate asset-specific data; early in a deployment, alerting is largely threshold-based, and predictive confidence grows as the baseline matures. The output is not just "something is wrong" but "this asset, this likely issue, this urgency, act within this window."
Stage 7 — Convert Insight into Maintenance Action
This is the most important stage, and the one most often neglected. Insight only creates value when it changes what the maintenance team does: prediction → risk assessment → maintenance priority → work planning → intervention → verification → data update.
Ideally the twin integrates with the CMMS/EAM so a prediction can generate a work order automatically, and the completed maintenance record flows back into the twin. That feedback is what makes it a loop: every intervention teaches the system, sharpens the baseline, and improves the next prediction.
The Difference That Matters
A Digital Twin that ends at a dashboard is a monitoring tool. A Digital Twin that closes this loop — from prediction all the way back to updated asset intelligence — is an asset-intelligence system.
Digital Twin Predictive Maintenance Maturity Model
Not every organisation needs — or can absorb — a full intelligent twin on day one. This five-level model helps teams locate where they are and plan the next step.
| Level | Name | What exists | What it delivers |
|---|---|---|---|
| 1 | Static Asset Information | 3D / BIM model | Accurate as-built record; no live data |
| 2 | Connected Asset | BIM + IoT sensors | Live readings tied to the asset |
| 3 | Monitored Asset | BIM + IoT + dashboards | Real-time visibility and alerting |
| 4 | Predictive Asset | Monitoring + analytics + anomaly detection | Early warning of developing issues |
| 5 | Intelligent Asset | Prediction + risk prioritisation + maintenance action + continuous learning | A closed decision loop that improves over time |
Level 1 → 2 requires sensorisation and reliable data transport. Level 2 → 3 requires integration and dashboards that people actually use. Level 3 → 4 requires establishing behaviour baselines and analytics — the jump most organisations underestimate. Level 4 → 5 requires connecting insight to maintenance workflows and feeding results back in.
Most infrastructure owners today sit between Levels 1 and 3. The commercial value concentrates at Levels 4 and 5 — which is precisely why a focused, well-executed pilot on critical assets tends to outperform a broad, shallow rollout.
How a Digital Twin Predictive Maintenance System Works: The Architecture
Underneath the workflow sits a layered technical architecture. It maps closely to how standards such as ISO 23247 structure a digital-twinning system — from the observable physical element, through data collection and communication, to the twin itself and the applications that use it.
Each layer has a job. The physical and connectivity layers get trustworthy data off the asset. The data layer stores and organises it. The intelligence layer interprets it. The Digital Twin layer fuses model, data, history and analytics into a single contextual environment. The decision layer is where humans and systems act.
The end-to-end data flow through this stack is worth spelling out, because every stage adds meaning: physical asset → sensors → edge/gateway → data transmission → cloud/data platform → analytics → Digital Twin → asset health intelligence → predictive insight → maintenance decision → physical intervention → updated asset data.
The final arrow — updated asset data — loops back to the start. A twin that never updates decays into a stale model.
Technologies Behind Digital Twin Predictive Maintenance
Several established technologies combine to make this work:
- Reality capture and BIM — LiDAR laser scanning, photogrammetry and scan-to-BIM produce the accurate spatial foundation.
- IoT sensors and edge computing — wireless and wired sensors with edge gateways that pre-process data at source.
- Time-series data platforms — for storing and querying high-frequency telemetry at scale.
- Analytics and machine learning — for baselining normal behaviour, detecting anomalies and forecasting failure modes.
- Integration layers — secure APIs connecting the twin to SCADA, BMS, CMMS/EAM and ERP systems so insight becomes action.
- Visualisation — dashboards and 3D/GIS interfaces that place data in spatial context.
Real-World Applications
The framework is easier to grasp through concrete infrastructure scenarios.
1. Bridges
A bridge is instrumented with an appropriate mix of vibration sensors, accelerometers, tiltmeters, strain gauges and displacement (GNSS) sensors. Over an initial monitoring period, the system learns the bridge's normal dynamic response under traffic, temperature and wind. If vibration signatures or displacement patterns begin drifting outside that baseline, the twin raises an anomaly, engineers assess it against the structural model, and — if warranted — a targeted inspection or maintenance action is planned before a small issue becomes a serious one. This is the logic behind continuous structural health monitoring and platforms such as BridgePulse, which pairs AI and drone technology with sensor data for bridge health assessment.
2. Industrial Equipment
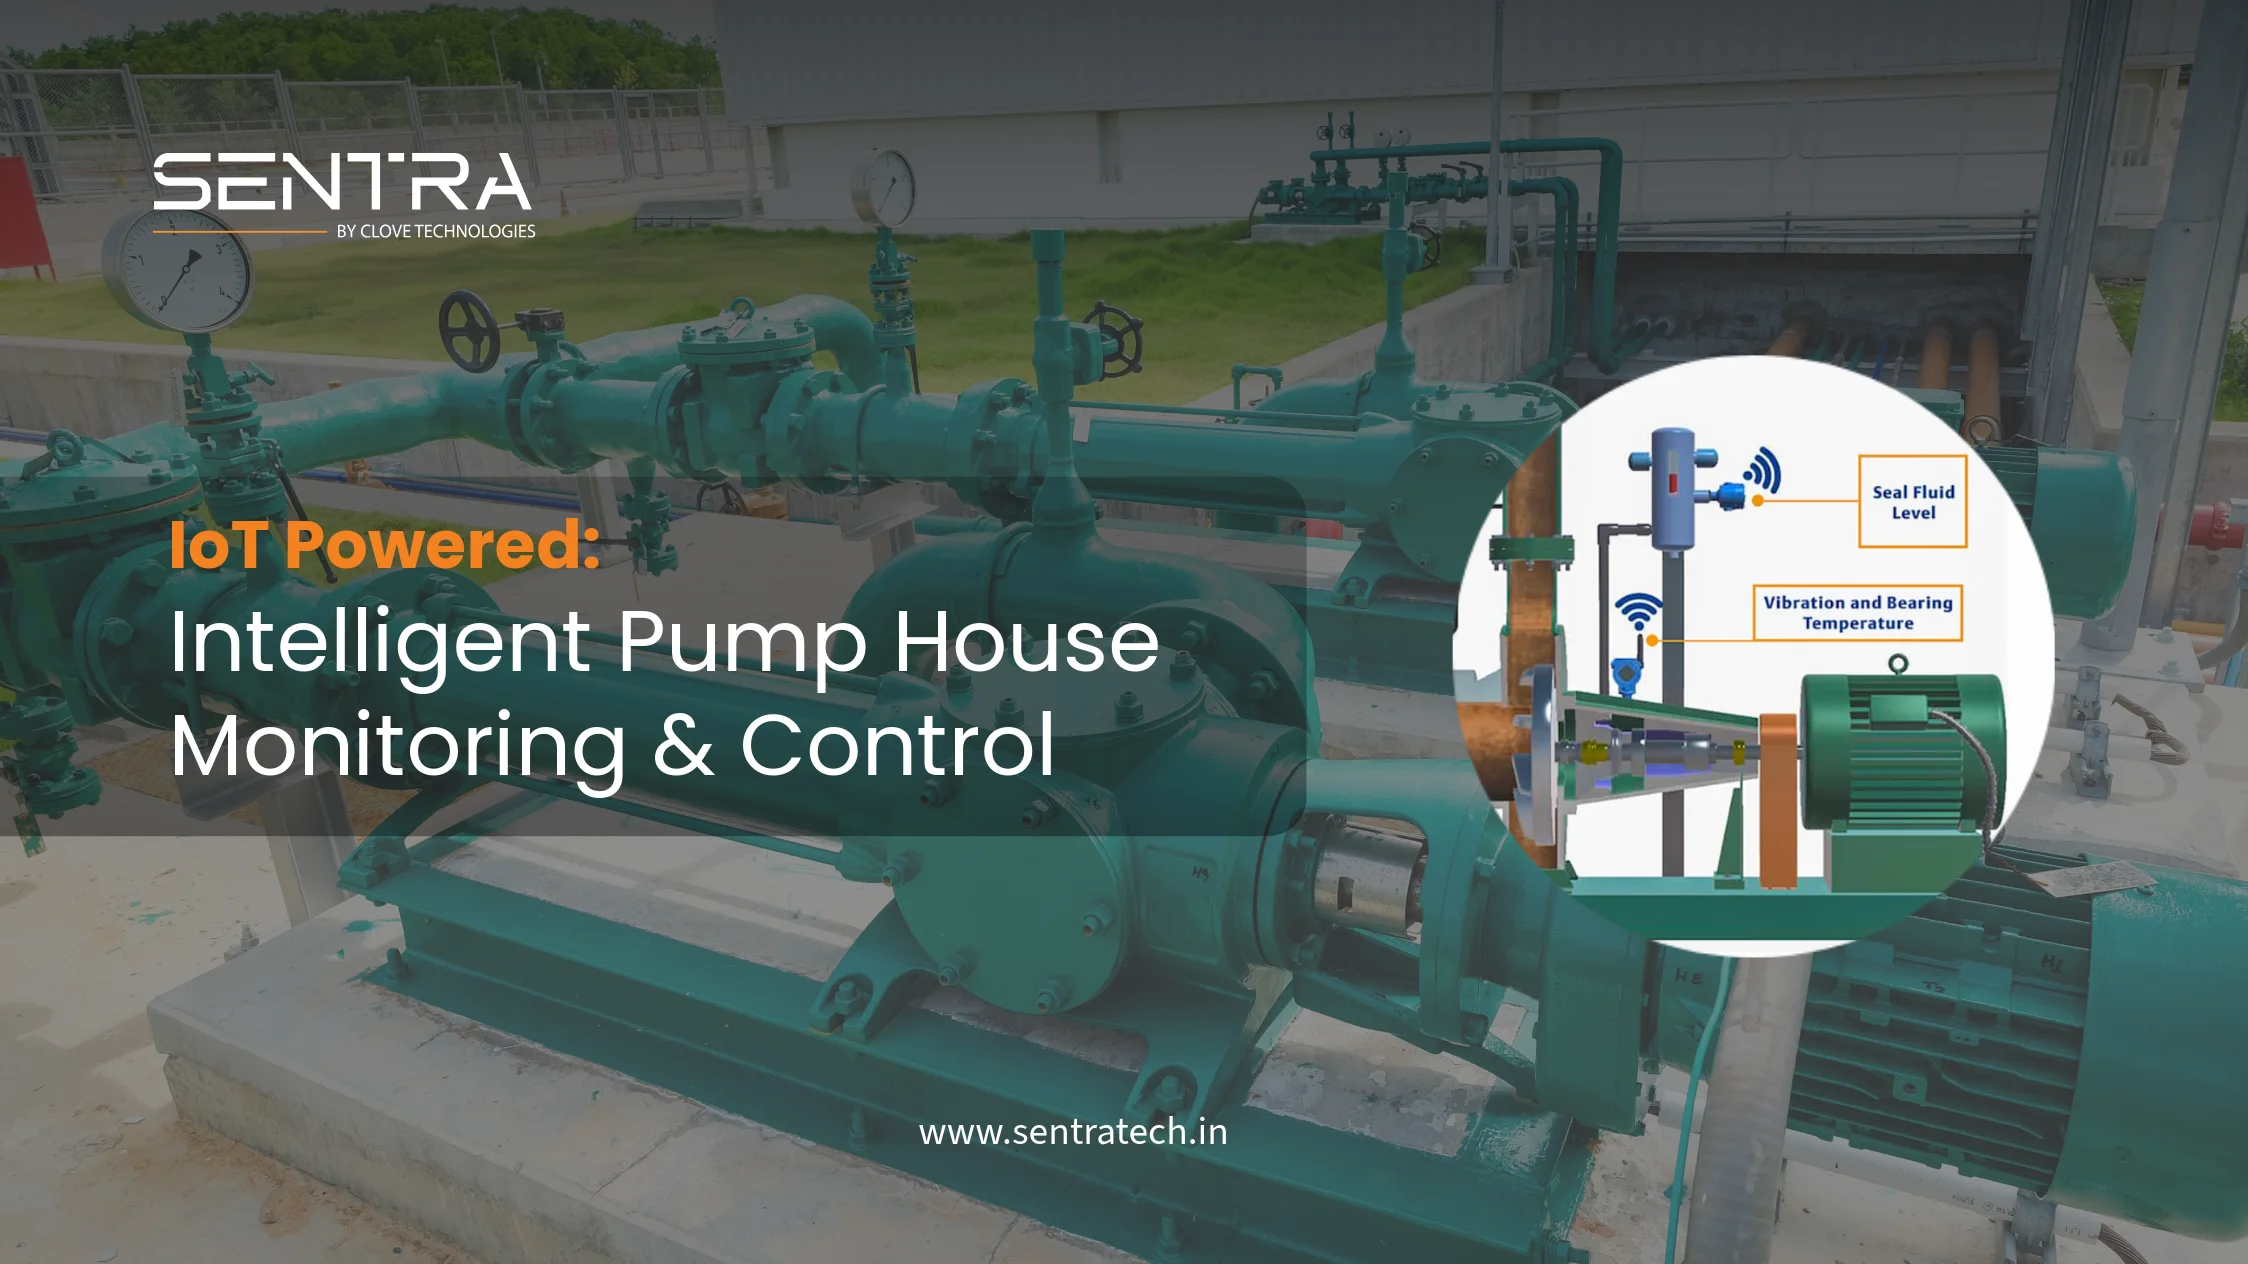
A pump or motor is monitored for vibration, temperature and power draw. Bearing wear, imbalance or misalignment rarely fails instantly — it develops through detectable stages. A gradual rise in vibration amplitude or energy consumption signals developing deterioration; the twin flags the trend, estimates remaining useful life, and maintenance is scheduled into a planned window rather than triggered by a breakdown at the worst possible time.
3. Railway Infrastructure
Across a rail network of bridges, structures and equipment, a Digital Twin provides unified asset visibility, continuous condition monitoring, maintenance planning and lifecycle management from a central view — allowing a small engineering team to oversee geographically distributed assets without being physically present at each one. Sentra's work on IoT bridge monitoring across railway bridges illustrates this pattern.
4. Smart Infrastructure and Cities
At city scale, a Digital Twin connects BIM and GIS with IoT feeds and operational data to create centralised asset intelligence across many asset classes at once — a foundation for planning, monitoring and managing urban infrastructure from a single geospatial environment. This is the natural extension of asset-level twins into network- and city-level decision-making.
Benefits of Digital Twin for Predictive Maintenance
Benefits are only convincing when tied to the business problem they solve.
| Business problem | What the twin adds | Outcome |
|---|---|---|
| Unexpected downtime | Continuous condition monitoring | Earlier intervention, fewer surprises |
| Over-maintenance | Condition-based maintenance | Work done when needed, not on the calendar |
| Disconnected asset data | Unified Digital Twin | Centralised asset intelligence |
| Manual, periodic inspections | Continuous monitoring | Better situational awareness between inspections |
| Short asset life | Predictive maintenance | Lifecycle optimisation and extended service life |
| Maintenance uncertainty | Asset-health analytics | Risk-informed, evidence-based decisions |
How Do Digital Twins Reduce Maintenance Costs?
Digital twins reduce maintenance costs mainly by shifting spend from expensive unplanned events to cheaper planned ones, and by removing unnecessary work. The savings come from several mechanisms rather than a single lever: less unplanned downtime, better prioritisation of maintenance effort, fewer unnecessary interventions, more efficient resource and spare-parts allocation, extended asset lifecycles, faster fault investigation, and better overall asset visibility.
It is worth being disciplined about numbers here. Industry research — including long-standing U.S. Department of Energy work — consistently finds that condition-based and predictive strategies cost substantially less than reactive maintenance, and that unplanned failures are the single most expensive category of maintenance spend. But the specific percentage an organisation achieves depends on its starting point, asset mix, data quality and how well insight is connected to action. Treat published figures as evidence of direction and mechanism, not as a promise of a specific return.
Challenges and Implementation Considerations
Digital Twin implementation is not effortless. Being honest about the obstacles is the best way to plan around them.
- Data quality — Poor or sparse sensor data produces poor predictions. Address it by prioritising reliable instrumentation on critical assets and validating data before trusting it.
- Legacy systems and interoperability — Existing SCADA, CMMS and ERP systems rarely share data cleanly. Address it with standards-based integration and secure APIs rather than bespoke point-to-point links.
- Sensor reliability and connectivity — Field sensors fail; networks drop. Address it with edge buffering, local alarms and a maintenance regime for the monitoring hardware itself.
- Cybersecurity — Connecting operational assets to networks widens the attack surface. Address it with secure-by-design architecture, segmentation and access control from the outset.
- Model maintenance — A twin that is not updated becomes misleading. Address it by building model updates into operational processes, not treating the twin as a one-off deliverable.
- Analytics maturity and skills — Baselining and anomaly detection require expertise many teams don't have in-house. Address it by starting with a focused scope and partnering for the analytics capability while internal skills grow.
- Cost and organisational adoption — Upfront investment and change resistance are real. Address it with a pilot that proves value on a critical asset before scaling, so the business case is evidence-based rather than theoretical.
How to Implement a Digital Twin for Predictive Maintenance
An Eight-Phase Roadmap
- Asset assessment — identify critical assets, existing data, existing systems, monitoring requirements and business objectives.
- Digital foundation — prepare BIM/3D models, GIS, the asset register and historical data.
- Sensorisation — specify and deploy the right sensors for each asset type.
- Data integration — connect IoT, operational systems and asset data.
- Digital Twin creation — build the connected environment that fuses model and data.
- Analytics — establish baselines, rules, anomaly detection and predictive models.
- Maintenance integration — connect insight to maintenance planning, work orders and inspection workflows.
- Scale — expand from a pilot asset to an asset group, then a facility, then the network.
How Can an Organisation Start?
Start narrow and go deep. A practical six-step starting approach:
- Select one critical asset — where failure would have the greatest operational or safety impact.
- Define its failure modes — what actually goes wrong, and how it shows up in data.
- Identify the required data — the specific signals needed to see those failure modes developing.
- Establish monitoring — instrument the asset and get reliable data flowing.
- Build the Digital Twin — connect model, data and analytics for that asset.
- Measure operational outcomes — downtime avoided, interventions optimised, cost saved — and use the evidence to justify scaling.
A focused pilot on the highest-value assets beats attempting to digitise an entire infrastructure network at once. It is faster to deliver, easier to fund, and it produces the proof needed to expand with confidence. As a benchmark, a well-scoped deployment covering a few dozen critical assets can typically move from site survey to a live monitoring dashboard in a matter of weeks, not years.
How Sentra Approaches Intelligent Asset Monitoring
Sentra brings together the two halves this challenge requires: the digital engineering that builds an accurate asset foundation, and the IoT monitoring that keeps it alive with real-world data.
On the foundation side, Sentra's digital engineering and documentation services cover reality capture, scan-to-BIM and digital twin integration — connecting BIM models to live sensor data and delivering information in line with ISO 19650 so it stays usable across the asset lifecycle.
On the live-data side, Sentra's asset monitoring and management platform is IoT-native: it deploys vibration, temperature, pressure, flow, power and environmental sensors on critical assets, transmits data through edge-processing gateways, and presents real-time health status, trend analysis and predictive maintenance alerts through a multi-asset dashboard. It integrates with existing CMMS, ERP and SCADA systems — so a monitoring alert can flow straight into a work order rather than sitting on a screen.
This maps directly onto the loop described in this article, following a clear sequence:
Monitor → Understand → Predict → Act
Complementary capabilities — structural health monitoring, bridge inspection and condition assessment, fatigue and residual life assessment and geotechnical and foundation monitoring — extend the same predictive philosophy across civil and structural assets, from railway bridges to smart-city infrastructure.
The Question Worth Asking
We are collecting asset data — but are we actually using it to predict what happens next? If the answer is uncertain, that is the conversation to have.
This article is for general information and does not constitute engineering, financial or legal advice. Statistics attributed to third parties reflect published research and outcomes vary by context.
Frequently Asked Questions
It is a dynamic digital representation of a physical asset that combines asset information, live sensor data, operational data and analytics to monitor condition, detect abnormal behaviour and support maintenance decisions before failures occur — continuously updating as the asset changes.
It provides the connected environment where live data is contextualised against the asset model and its history, so analytics can establish normal behaviour, detect anomalies, predict likely failure modes, prioritise action, and feed maintenance results back in to keep improving.
Predictive maintenance is the strategy (maintain based on actual condition and predicted risk). A Digital Twin is the enabling environment that makes that strategy scalable, spatial and continuous across many assets.
A BIM model is a mostly static digital representation created chiefly for design and construction. A Digital Twin connects that model to live data, maintenance systems and operational records, creating a continuously updated representation of the asset's current state. BIM is the foundation; the twin extends it into operations.
An accurate asset model (BIM/CAD/GIS), an asset register and history, and live condition data from sensors — plus a learned baseline of normal behaviour so deviations can be interpreted rather than just flagged.
Commonly vibration, temperature, pressure, flow, power and environmental sensors for equipment, and structural sensors such as accelerometers, tiltmeters, strain gauges and GNSS displacement units for civil assets. The right suite depends on the asset and its failure modes.
They can help anticipate developing failures by detecting deviations from normal behaviour and forecasting likely failure modes and timeframes. Accuracy depends on data quality and model maturity and improves as the system learns each asset — it supports better decisions rather than guaranteeing certainty.
Yes. Long-lived infrastructure assets — bridges, railways, utilities, water systems — benefit strongly, because continuous monitoring and lifecycle trends inform safety, reliability and capital planning over decades.
Yes. A bridge twin combines the structural model with vibration, displacement, strain and tilt sensors to learn normal dynamic behaviour and flag anomalies for engineering assessment before they escalate.
Sensors send data to an edge gateway, which pre-processes and forwards it over a network to a cloud data platform; the data is stored as time-series telemetry, associated with the correct asset, and surfaced in the twin.
Mainly by shifting spend from expensive unplanned events to cheaper planned ones, and by removing unnecessary work — less unplanned downtime, better prioritisation, fewer unnecessary interventions, more efficient spares allocation, extended asset life, and faster fault investigation.
Cost depends on asset count and type, sensor requirements, integration complexity and analytics scope. Most organisations start with a focused pilot on critical assets to establish costs and returns before committing to a full network rollout.
Assess critical assets, build the digital foundation, deploy sensors, integrate data, create the twin, add analytics and baselines, connect insight to maintenance workflows, then scale from pilot to network.
Data quality, legacy-system interoperability, sensor and network reliability, cybersecurity, keeping the model updated, analytics maturity and skills, and organisational adoption. A phased pilot approach manages most of these.
Sentra combines digital engineering (scan-to-BIM, digital twin integration, ISO 19650 information management) with an IoT-native asset monitoring platform — edge-connected sensors, real-time dashboards, predictive alerts, and integration with CMMS/ERP/SCADA — following a Monitor → Understand → Predict → Act approach.
Ready to See Predictive Monitoring on Your Assets?
Whether you need IoT sensor deployment, real-time monitoring dashboards, or a full Digital Twin implementation, Sentra Technologies has the expertise and technology to help you protect your assets.
Contact us